
How to convert CSV to GeoJSON
- Drag your CSV onto the drop zone, or click to browse for it.
- Confirm the location columns: latitude and longitude headers are detected, and a WKT column is preferred when one is found.
- Choose GeoJSON and convert, then download an RFC 7946 FeatureCollection.
What changes when you convert CSV to GeoJSON
| What | CSV → GeoJSON | |
|---|---|---|
| Geometry | Kept | Each row with coordinates becomes a point feature. If the table has a WKT geometry column, its lines and polygons are rebuilt as real shapes. |
| Attributes | Kept | Every column and full field name moves from CSV into GeoJSON untouched. |
| Styling & labels | Kept | Neither CSV nor GeoJSON stores visual styling, so there is nothing to lose. Geometry and data carry straight over. |
| Coordinate system | Changes | CSV carries no coordinate system, so values are read as WGS84 longitude/latitude (EPSG:4326), which GeoJSON requires. Set a source CRS if your data is in meters. |
| Elevation (Z) | Not stored | CSV has no 3D geometry. An elevation column, if the table has one, rides along as an ordinary attribute rather than as Z height. |
| File structure | Kept | A single, self-contained .geojson file you can move around on its own. |
What your spreadsheet needs first
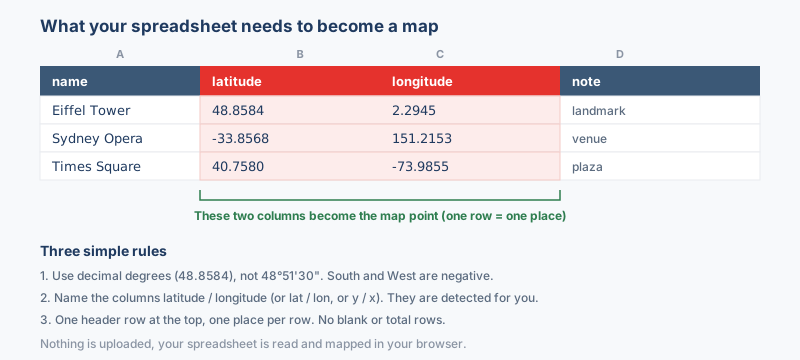
Two columns are enough: a latitude and a longitude in decimal degrees turn each row into a GeoJSON point feature for your web map. Every other column, a name, a date, an ID, a reading, becomes a property on that feature, ready for popups and style expressions in Leaflet or Mapbox GL. No template and no fixed column order are needed.
The columns that matter
- Latitude between -90 and 90, negative south of the equator. Headers such as
lat,latitudeoryare detected automatically. - Longitude between -180 and 180, negative west of Greenwich. Headers such as
lon,lng,longitudeorxare detected the same way. - A WKT column for lines and polygons. LINESTRING and POLYGON text is rebuilt as real features, and this column is preferred when one is found.
Store coordinates as plain decimal degrees, 33.6844 and 73.0479, with a decimal point rather than a comma. A value like 33°41'04"N reads as text; run it through the coordinate converter first. A plain .csv or a CSV exported from Excel or Google Sheets works, and the dropdowns above the Convert button correct a wrong column guess before anything is written.
Why convert CSV to GeoJSON?
The properties carry the exact header names you used in the sheet, so you can style or filter features in Leaflet with the same attributes you edited in Excel. Pass the download to L.geoJSON or a Mapbox GL geojson source with no extra step, since the output follows RFC 7946. GeoJSON is also plain JSON text, which means the map data can travel through web APIs and sit in version control with readable diffs. A WKT column takes the sheet beyond points: LINESTRING and POLYGON text comes out as real line and polygon features.
Coordinate system handling
A spreadsheet has no coordinate system of its own. CSV rows are read as WGS84 longitude/latitude (EPSG:4326) unless you tell the tool otherwise. If your coordinates are projected, for example UTM eastings and northings in meters, pick the matching CRS before converting so the points land in the right place instead of near Null Island (how to find the EPSG code).
GeoJSON is defined in WGS84 (EPSG:4326), so the output is reprojected to longitude/latitude, exactly what Google Earth and web maps expect.
What to check when converting CSV to GeoJSON
A CSV only becomes spatial when it carries latitude and longitude, an X and Y pair, or geometry as WKT. A row with a mistyped or blank coordinate is skipped, so a missing point on the map usually traces back to one bad cell. Values need to be WGS84 decimal degrees, or declared in their true system and reprojected, because RFC 7946 allows nothing else, and the output lists longitude before latitude, the reverse of everyday habit.
Troubleshooting CSV to GeoJSON
- Every point sits in the ocean off West Africa. Coordinates of 0,0 land at Null Island, which means the coordinate columns were empty or not recognized. Pick the right columns in the dropdowns, make sure the cells hold real numbers, and convert again.
- The map draws in the wrong hemisphere. Latitude and longitude are swapped, or a minus sign went missing during an export. Check that latitude sits between -90 and 90 and that western longitudes are negative.
- Some rows are missing from the FeatureCollection. A blank or non-numeric coordinate removes the row rather than placing it at zero. Sort the sheet by the coordinate columns to surface blanks and stray text, then fix and reconvert.
About the formats
CSV is where tabular data usually starts, whether exported from Excel, a Google Sheet or a pandas script, and GeoJSON is where a web map wants it. The conversion reads the coordinate columns in each row and wraps every point as a feature, turning flat spreadsheet rows into structured vector data. The pairing bridges the gap between analysts who edit rows and developers who render maps, and nothing in the chain needs a GIS install.
Frequently asked questions
Why are a few points missing from the finished map?
Rows without valid coordinates are skipped, and a mistyped cell, a blank, or a number stored as text with a decimal comma all count as invalid. Fix those rows in the sheet and run the file through again.
Will eastings and northings in meters work as input here?
Yes, if the matching coordinate system is picked before converting, because the output is then reprojected to longitude and latitude. Read as degrees instead, meter values put every point near Null Island, in the ocean off West Africa.
Why does longitude come before latitude in the output file?
GeoJSON lists longitude, then latitude, X before Y, and that order comes straight from the RFC 7946 specification. Map libraries expect it, so nothing needs swapping on your side.
Do the CSV column headers become properties on each feature?
Yes. Every column that is not consumed as a coordinate is written into the feature's properties object, keyed by its header name. The latitude and longitude columns themselves become the geometry.
Can I build lines or polygons, not just points?
A latitude and longitude pair produces one point per row. To build lines or polygons, put the geometry as WKT text in its own column, and LINESTRING or POLYGON strings are rebuilt as real features.
Related converters
Ready to convert?
Drop a file and download the result in seconds. Nothing is uploaded, nothing is stored.