
How to convert Excel to GeoJSON
- Drop the .xlsx file straight in; there is no need to export a CSV first.
- Confirm the location columns; WKT is used when available, and latitude and longitude pickers handle plain point sheets.
- Choose GeoJSON and convert, then add the output to Leaflet or Mapbox GL.
What changes when you convert Excel to GeoJSON
| What | Excel → GeoJSON | |
|---|---|---|
| Geometry | Kept | Each row with coordinates becomes a point feature. If the table has a WKT geometry column, its lines and polygons are rebuilt as real shapes. |
| Attributes | Kept | Every column and full field name moves from Excel into GeoJSON untouched. |
| Styling & labels | Kept | Neither Excel nor GeoJSON stores visual styling, so there is nothing to lose. Geometry and data carry straight over. |
| Coordinate system | Changes | Excel carries no coordinate system, so values are read as WGS84 longitude/latitude (EPSG:4326), which GeoJSON requires. Set a source CRS if your data is in meters. |
| Elevation (Z) | Not stored | Excel has no 3D geometry. An elevation column, if the table has one, rides along as an ordinary attribute rather than as Z height. |
| File structure | Kept | A single, self-contained .geojson file you can move around on its own. |
What your spreadsheet needs first
A latitude column and a longitude column in decimal degrees are all a sheet needs; each row then becomes a GeoJSON point feature, with every other column carried as a property for popups and styling. Number cells stay numeric, which is the practical gain over a detour through CSV. The first worksheet is the one that is read, so keep the mappable rows there.
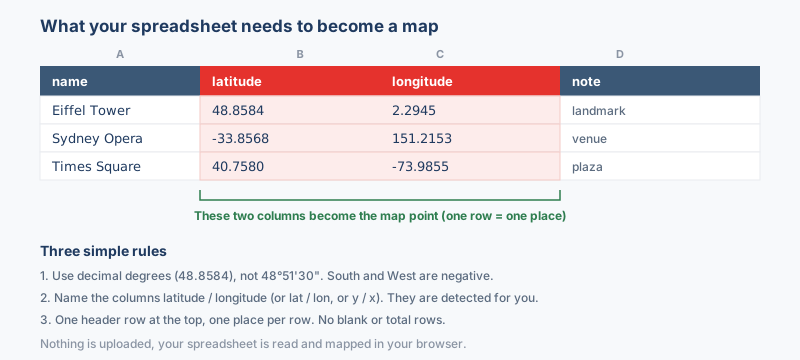
The columns that matter
- Latitude, a number between -90 and 90, headed
lat,latitudeoryso it is picked up automatically. - Longitude, a number between -180 and 180, headed
lon,lng,longitudeorx. - A WKT column when the sheet describes lines or polygons; the text is rebuilt as real line and polygon features.
Keep the values as decimal degrees, 33.6844 and 73.0479, not degrees-minutes-seconds text; the coordinate converter translates the latter. Only .xlsx is read, and an older .xls is turned away with a request to save it as .xlsx first.
Why convert Excel to GeoJSON?
Excel keeps winning because it is easy to type, sort and share with colleagues outside GIS, while a web map cannot read a workbook at all. Reading the .xlsx directly skips the usual export to CSV and keeps number cells numeric, so IDs and measurements stay usable in popups and style expressions without cleanup. The output is plain readable JSON that passes through web APIs untouched and lives in version control alongside the code that renders it.
Coordinate system handling
A spreadsheet has no coordinate system of its own. Excel rows are read as WGS84 longitude/latitude (EPSG:4326) unless you tell the tool otherwise. If your coordinates are projected, for example UTM eastings and northings in meters, pick the matching CRS before converting so the points land in the right place instead of near Null Island (how to find the EPSG code).
GeoJSON is defined in WGS84 (EPSG:4326), so the output is reprojected to longitude/latitude, exactly what Google Earth and web maps expect.
What to check when converting Excel to GeoJSON
Make sure the coordinate columns hold decimal degrees, not projected meters, because RFC 7946 GeoJSON is defined in WGS84 with longitude written before latitude. A sheet in a UTM zone still converts when you set that system first, and the output is reprojected on the way through. Cell values are the only thing that crosses over: formulas convert at their computed result, charts and formatting are dropped, and only .xlsx is accepted, with an old .xls rejected and a prompt to save it as .xlsx.
Troubleshooting Excel to GeoJSON
- The workbook was rejected on drop. Only the .xlsx format is read, so an .xls from an older Excel is refused with a request to save it as .xlsx first. File > Save As in Excel converts it without touching the data.
- Rows from a second sheet never appear. Conversion runs on the first worksheet only. Bring the rows onto sheet one, or split the workbook so each sheet becomes its own file, then convert each.
- All the points sit near Null Island. The coordinate columns hold projected meters that were read as degrees, or zeros from empty cells. Set the sheet's true coordinate system before converting, and check that the cells carry real decimal degrees.
- Numbers arrived as text properties. Cells formatted as text stay text in the JSON. Reformat the columns as numbers in Excel and convert again, so popups and style expressions can do math on them.
About the formats
A lot of location data starts life in Excel, where someone types addresses, sensor readings or survey points into a workbook with latitude and longitude sitting in their own columns. GeoJSON is where that same data has to land before a web map will draw it. This conversion reads each row, pairs your two coordinate columns into a point, and carries the other columns across as feature properties. The result turns a desk spreadsheet into something Leaflet or Mapbox GL can render.
Frequently asked questions
What happens to rows that carry no usable coordinates?
They are dropped rather than placed at a wrong spot, so a map with fewer points than expected usually means blank or text-formatted coordinate cells in the sheet.
Can I keep the map data in version control?
Yes. GeoJSON is readable JSON text, so edits show up line by line in Git, which a binary workbook can never offer.
Does the output open in QGIS as well as web maps?
Yes, it opens cleanly in QGIS alongside Leaflet, Mapbox GL and OpenLayers, so one file can serve the desktop reviewers and the web map.
Which worksheet and which columns end up in the GeoJSON?
The first worksheet is read, and the pickers confirm which columns hold latitude and longitude, or which column holds WKT. Every remaining column rides along as a property on its feature.
Can rows in a sheet produce lines or polygons?
Yes, when one column carries the geometry as WKT text; LINESTRING and POLYGON values are rebuilt as real line and polygon features, while plain coordinate columns make one point per row.
Related converters
Ready to convert?
Drop a file and download the result in seconds. Nothing is uploaded, nothing is stored.